Interpreting a 'Strand Report' (collection of objectives for a strand)
Show Average
Image 1 shows a 'Strand Report' (Collection of objectives for a strand) generated from the following:
| • | Judgements - Computing>Y3> Computer Science; |
| • | Show Most Recent - Unchecked. |
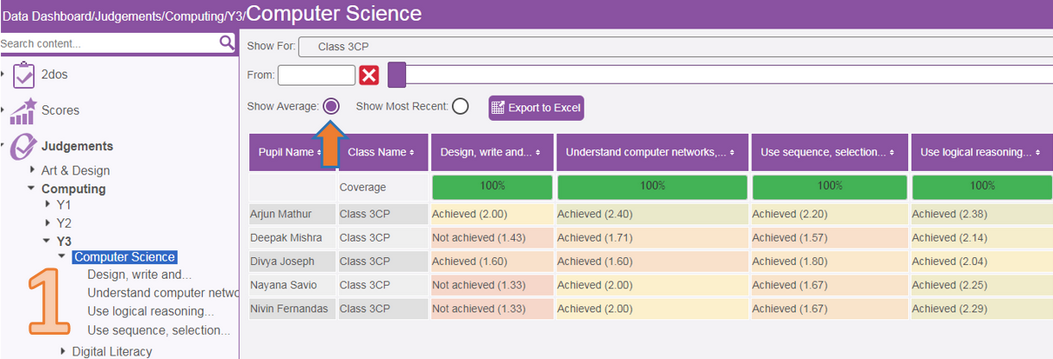
The data generated, shows an average for each pupil against all the objectives found within the Computer Science strand. Averages will also display the decimal number to provide additional information on how the average was calculated.
Coverage will be shown for each objective, which will identify if any of the selected pupils have been assessed 'Judged' against the objective.
Show Most Recent
Image 2 shows a 'Strand Report' (Collection of objectives for a strand) generated from the following:
| • | Judgements - Computing>Y3> Computer Science; |
| • | Show Average - Unchecked; |
| • | Show Most Recent - Checked. |
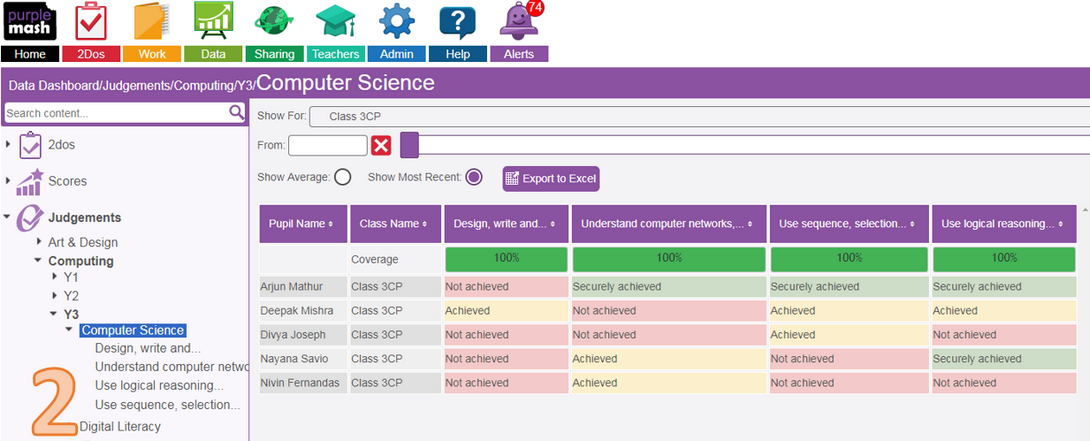
The data generated, now displays judgements against each objective for the very latest piece of work.
Coverage is shown for each objective which helps identify whether any child within 'Class 3CP' hasn't been assessed 'judged' for each objective.
Interpreting an 'Objective Report'
Show Average
Image 3 shows an 'Objective Report' (Judgements made against a single objective) generated from the following:
| • | Judgements - Computing>Y3> Computer Science>Design, write and debug programs; |
| • | Show Most Recent - Unchecked; |
| • | Show Progression - Unchecked. |
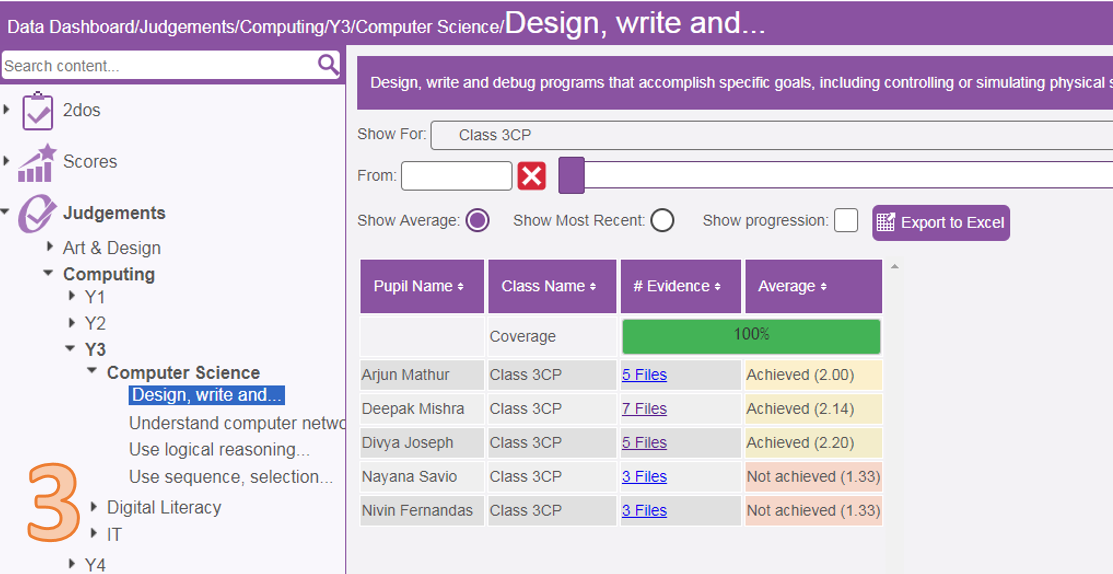
In this report we are given the average judgement for the 'Design, write and debug program' objective over the specified time. An additional column 'Evidence' is displayed which allows users to see the files which have this objective assigned to it with the judgements made. As previously, coverage is simply displayed using a graphical percentage representation.
Show Average; Show Progression
Image 4 shows an 'Objective Report' (Judgements made against a single objective) generated from the following:
| • | Judgements - Computing>Y3> Computer Science>Design, write and debug programs; |
| • | Show Most Recent - Unchecked; |
| • | Show Progression - Checked |
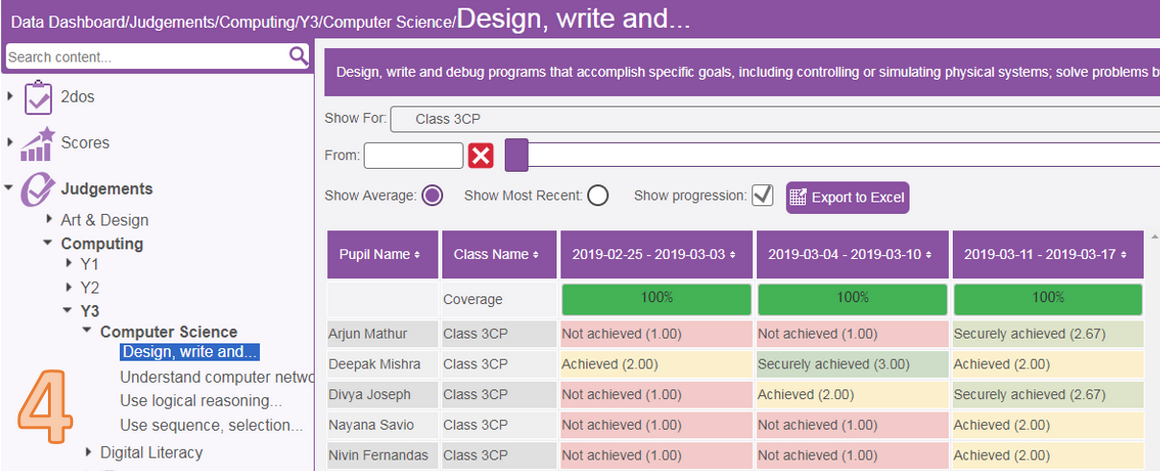
This report will now show an average for each week on the judgements made against the objective. This average could be made up of several pieces of work for each week. This progression view is helpful in identifying progress made in attainment for given pupils against an objective over time.
Show Most Recent
Image 5 shows an 'Objective Report' (Judgements made against a single objective) generated from the following:
| • | Judgements - Computing>Y3> Computer Science>Design, write and debug programs; |
| • | Show Most Recent - Checked; |
| • | Show Progression - Unchecked. |
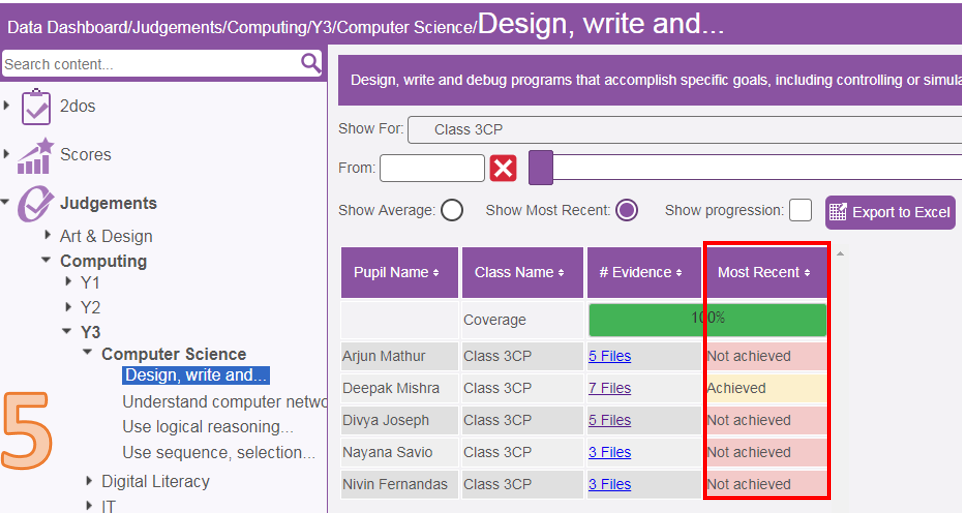
This report displays the judgement for the most recent piece of work which has the objective applied to it. You will notice the 'Evidence' column still in place. This contains the latest piece of work and previous pieces of work which have a judgment made against that objective.
Show Most Recent; Show Progression
Image 6 show an 'Objective Report' (Judgements made against a single objective) generated from the following:
| • | Judgements - Computing>Y3> Computer Science>Design, write and debug programs; |
| • | Show Most Recent - Checked; |
| • | Show Progression - Checked. |
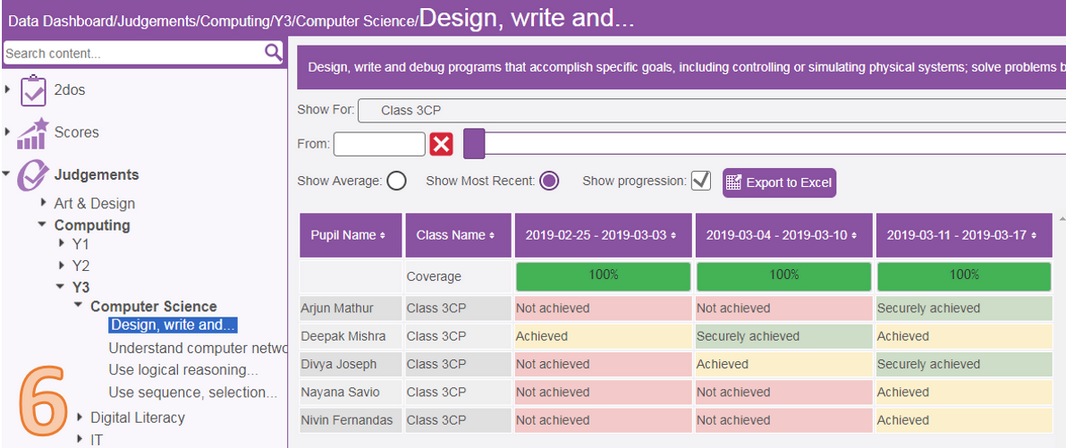
This report shows a week by week view of any judgement made against the objective for the selected pupils. Because 'Most Recent' has been selected, each week view will show the latest judgement for that week. For example, the week covering period: 2019 -02 -25 to 2019-03-03, Deepak had 2 pieces of work with the objective and judgement made against it, one on Monday 25th February 2019 and another on Friday 1st March 2019. Only Friday's judgement is represented for this week.
| 


