Interpreting a 'non-progression' scores report
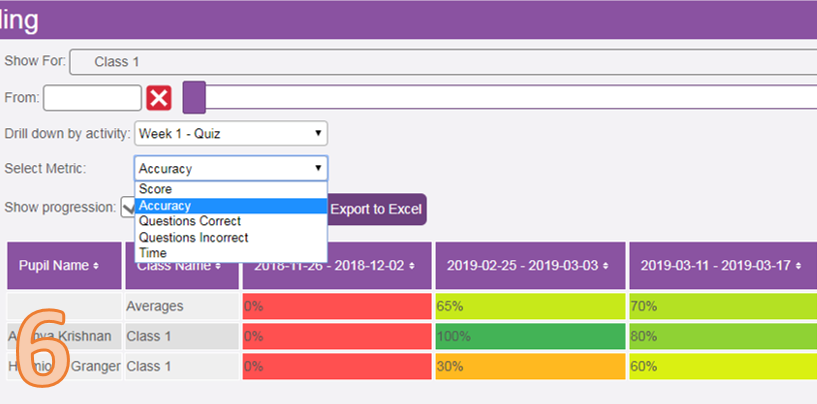
Image 1 shows a scores report generated from the following:
| • | Show for - all pupils assigned to teacher; |
| • | Scores type - 2Race; |
| • | Activity - Addition up to 20; |
| • | Select Metric - All; |
| • | Period - 2018-06-05 to 2018-11-21; |
| • | Show progression - Unchecked; |
| • | School hours only - Unchecked. |
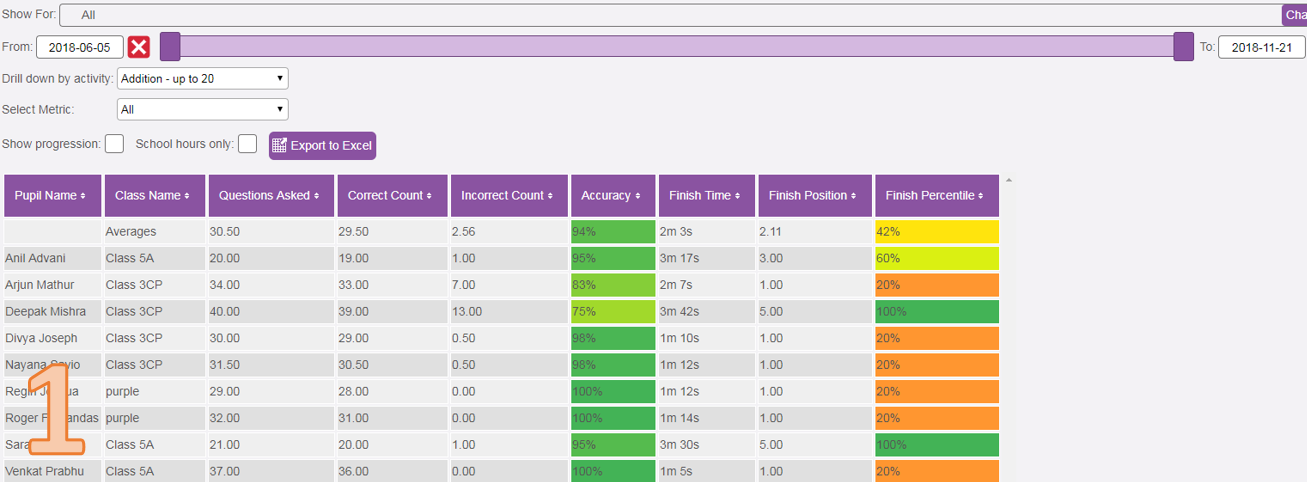
Columns
All the columns can be re-ordered by simply clicking on them. In this example, (image 2) they have been left to the default (Pupil Name - Alphabetical order).
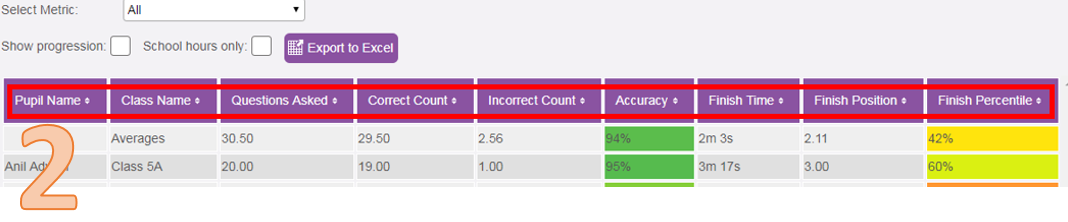
Averages
The top row highlighted (image 3) shows an average for all the columns. This is handy for teachers to use as a quick glance of how all pupils are performing within a group/cohort/class.
Digging a little deeper
By using the sorting feature, children at risk from under performing can be easily identified - the colour coding for 'Accuracy' and 'Finish Percentile' in this report are handy indicators. Along with 'Quesitons Asked' against 'Correct Count' compared against 'Averages' row.
Interpreting a 'progression' scores report
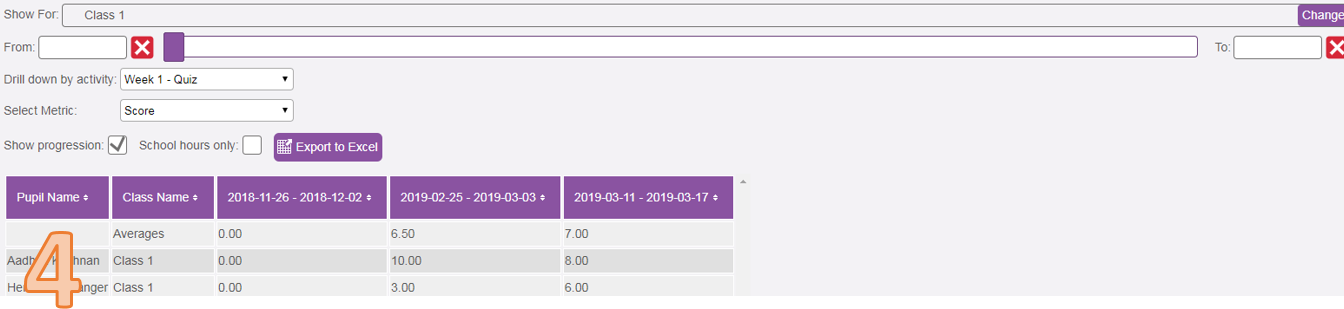
Image 4 shows a scores report generated from the following:
| • | Show for - Class 1; |
| • | Scores type - 2Quiz Spelling; |
| • | Activity - Week 1 Quiz (ai sound); |
| • | Select Metric - Score; |
| • | Period - All time; |
| • | Show progression - Checked; |
| • | School hours only - Unchecked. |
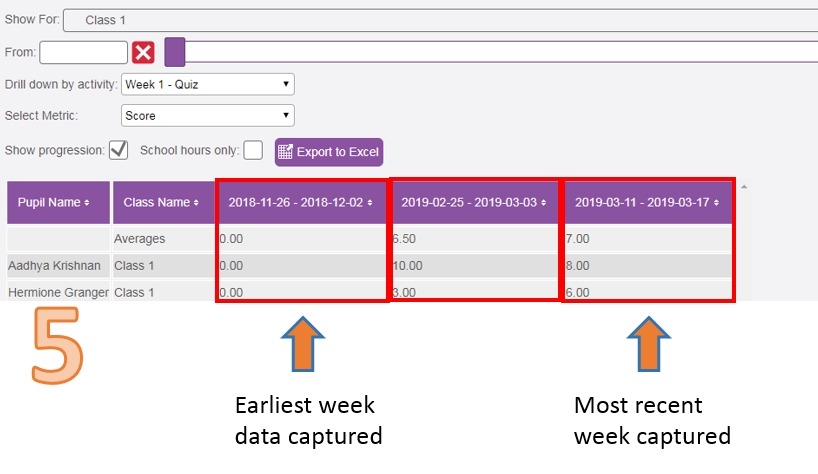
Date Columns
A progression report shows entries of data captured over time, with each date entry showing on a week by week basis. For example if two scores activities were completed each week. The data in each of the week columns represents an average of those activities. Image 5 shows an example, it is clear to see the most recent week is always in the furthest right column.
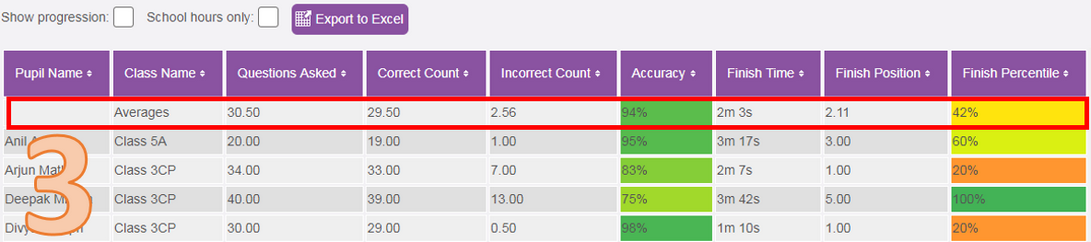
Changing metric
It is only possible to display one metric at a time when producing a progression report. Image 6 demonstrates a change of metric to 'Accuracy' which gives a very visual indicator over time of performance measured against 'Accuracy'.